A hierarchy is a systematic way of organizing the members of a dimension into a logical tree structure that defines parent-child aggregation relationships. Usually, hierarchies are balanced meaning that they have an equal number of levels in each branch of the hierarchy. If that is not the case, we are dealing with a ragged or unbalanced hierarchy which is a user-defined hierarchy that has an uneven number of levels.
NOTE: The unbalanced (ragged) hierarchies are not supported in Zebra BI Tables version 6.x. Please use Zebra BI Tables 5.4 version.
Hierarchies are very useful for organizing more complex data sets and enable more detailed data exploration with drill-down functionality. Learn how to create and use hierarchies in tables or chart visuals. However, all hierarchies in those examples are balanced.
If we are dealing with an unbalanced hierarchy this means that at least one branch does not descend to the lowest level. Three examples of this can be:
- Time hierarchy that includes Year, Quarter, and Month, one branch might only have data down to the Quarter level.
- Company organizational structure with some branches in the hierarchy having more levels than others.
- Income statement where some accounts have additional subcategories.
Let’s look at the Income statement example where we have two-level accounts hierarchy but for two accounts, we do not have value for the Account level. Displaying this in Power BI would result in “blank” fields.
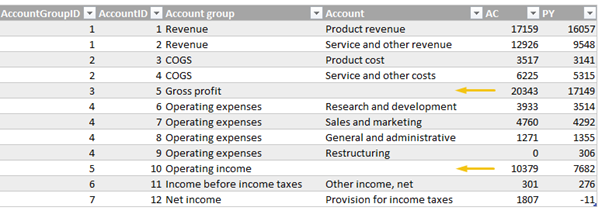
In order to avoid this, we must fulfill an empty cell with (preceding) parent values and Zebra BI visual will automatically detect that we are dealing with an unbalanced hierarchy.
The procedure for filling in the empty cells is as follows:
- Open Power Query Editor by clicking on Transform data.
- Right-click on the column you want to fill and select Replace Values.
- In the window »Replace With« type in each [Column you are filling from] and click OK. In this case, the column is called [Account group]). It will create a step “Replaced Value”, select it and remove quotes from both sides of “each [Account group]”.
- Now our blanks are filled with values from the selected column. If needed, repeat from step 2 onward for other columns.
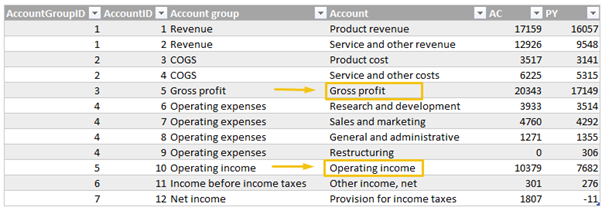
Now let us have a look at how the Account hierarchy will be displayed in Zebra BI Table visual. See how Gross profit and Operating income do not have a drill-down option despite having values on both levels of hierarchy? This approach makes your unbalanced hierarchies more organized and more user-friendly for end-users.
The example above was presented on a two-level hierarchy, but this approach can be used in the same way also on multilevel hierarchies. If you want to check how to create the example above, please check the hierarchy income statement.